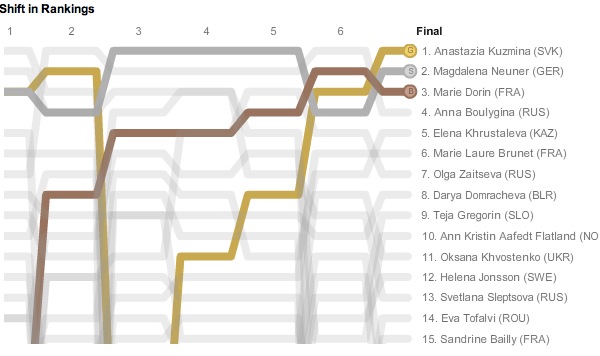
Although it’s not the sexiest of our graphics, we made a couple widgets, for lack of a better word, that lived on the Olympics results pages. One of them documented the shift in rankings for events with lots of splits. Shan Carter had written a small charting framework for Flash in 2010, and it included some methods to do a chart like this (which happens to be from the 2010 women’s biathlon 7.5k sprint):
But we don’t really use Flash anymore, so I tried to port Shan’s chart for the 2012 games (with embarrassing amounts of help and patience from my colleagues Tyson Evans and Ben Koski in Interactive News).
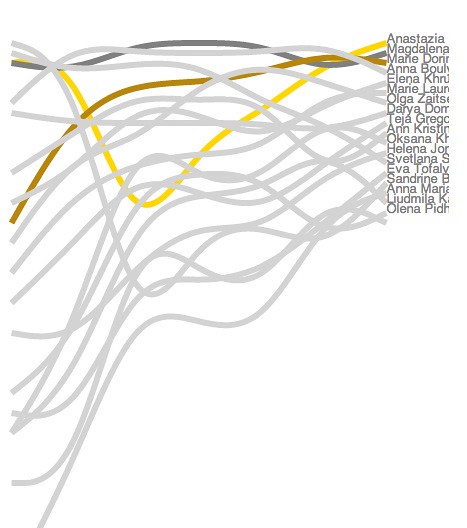
Like almost anything I program, this was adapted from a simple online tutorial. This one, from Stack Overflow, seemed to be almost exactly what I needed, but as far as I could tell, none of the D3 interpolations did what I needed the chart to do. Though it was fun to test out some of them:
I ended up having to make a custom interpolator in D3 to do it. I’m would post the code, but Mike Bostock (who, on a recent New York visit, actually groaned when he saw my implementation) made it possible to include your own custom interpolators for d3.svg.line() and d3.svg.area() in last week’s release of D3 2.10. Sweet!
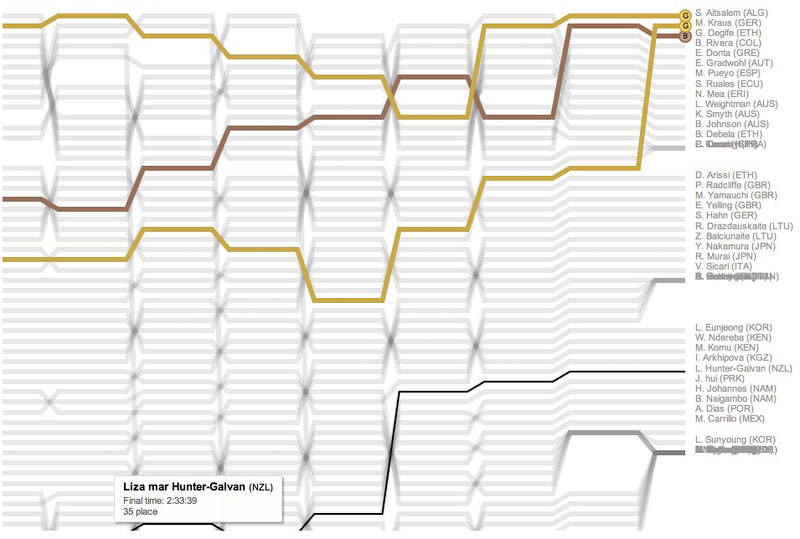
We were thinking about a few larger implementations of the framework, but in the end we didn’t have the time to do it right. Here’s one (broken) sketch based on some test data from the marathon:
Anyway, aside from a few bugs entirely traceable back to me, the rankings shifts in D3 worked out pretty well for swimming events. Here’s one of the more interesting ones, from the Women’s 400 IM.
