Last week I got a chance to drop various longer-term assignments and do a small amount of monkeying for my colleague Haeyoun Park, who had obtained some data from the N.O.A.A. on droughts in the contiguous United States going back more than a hundred years.
Every project is different, and when you’re on deadline, everyone just pitches in however they can to get the thing done in time. Haeyoun already knew exactly what she wanted: a grid of small multiples, showing one map per year. She had already done the reporting, gotten the data, made a map or two with GIS software to confirm that the idea would work. She just needed someone to crank out the maps. (Which is to say, she did almost all the work.)
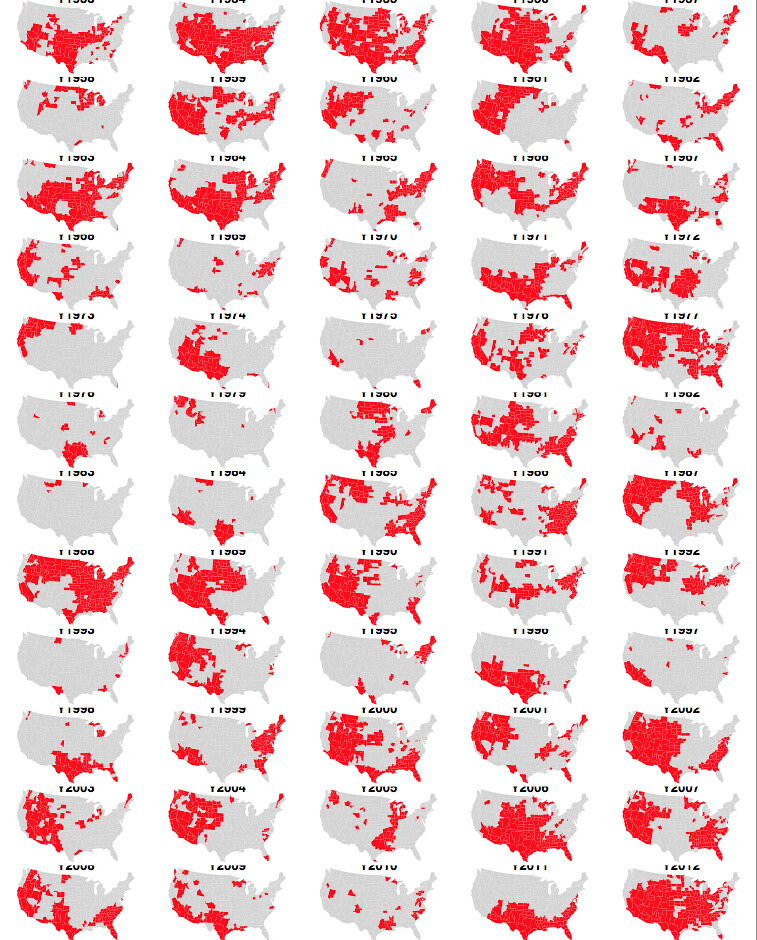
As far as the computation goes, these maps are extremely easy to make using maptools. Generally, it takes about 20 minutes to make the first map and about 10 seconds to make the next N maps. (Not that I didn’t need to ask Amanda to fix my code.) These were all written to a single PDF in the grid Haeyoun wanted (here, an area is shaded red if it is under moderate to extreme drought):
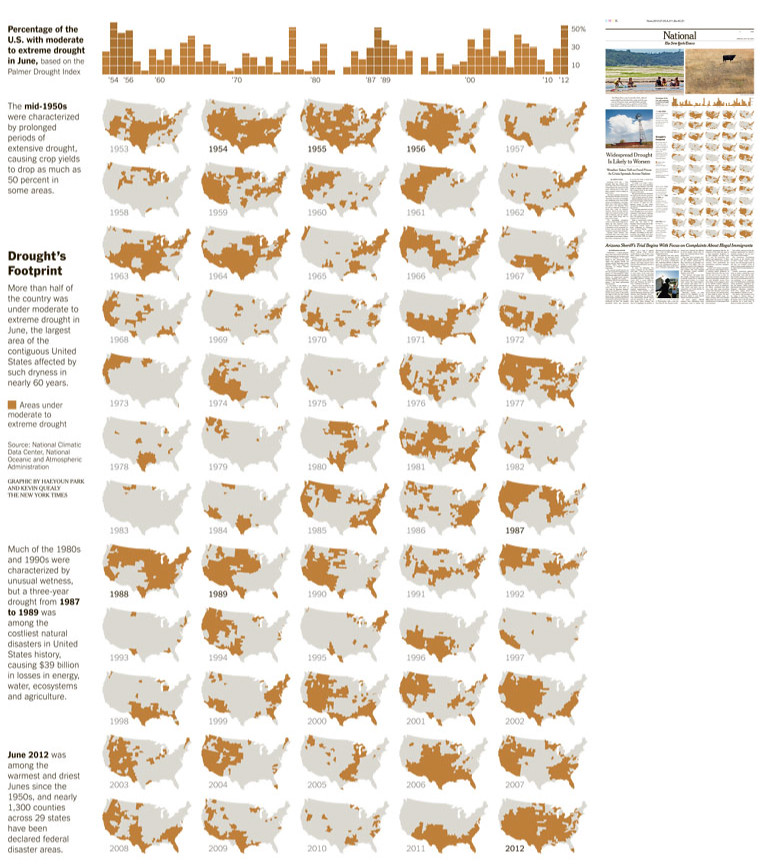
Which she annotated and cleaned up for print:
Archie Tse wanted to explore a couple different grid patterns for the web, since we had a little more space to deal with, and he had me export a few different sizes…
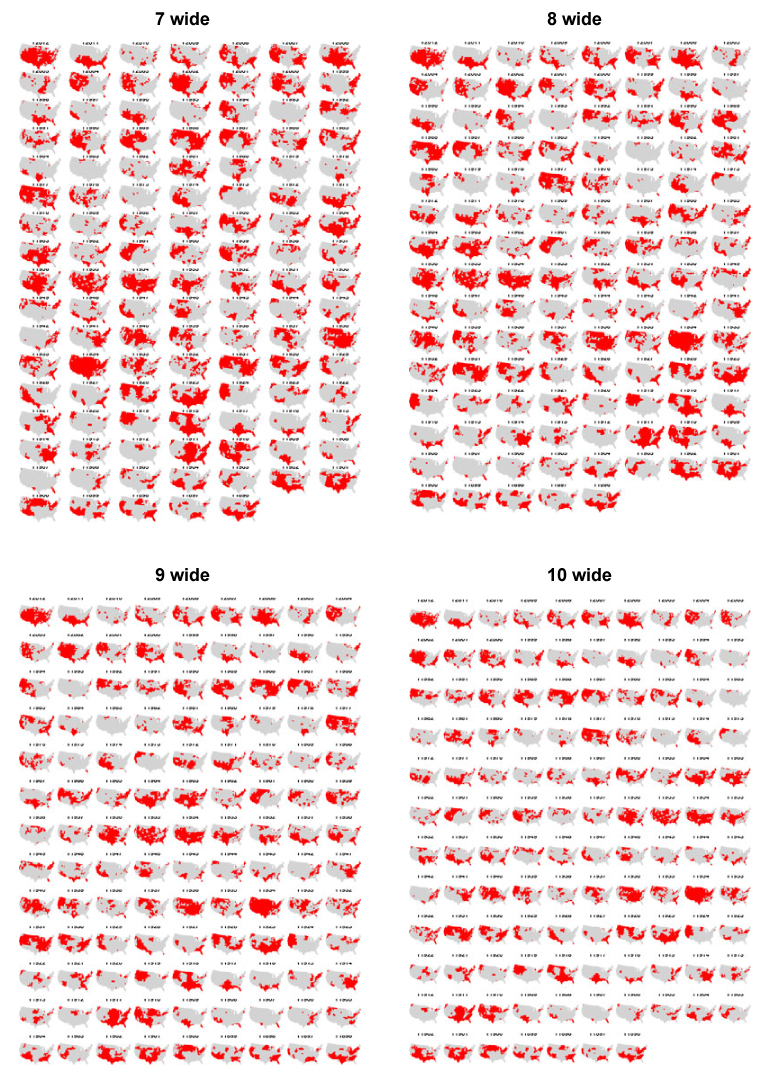
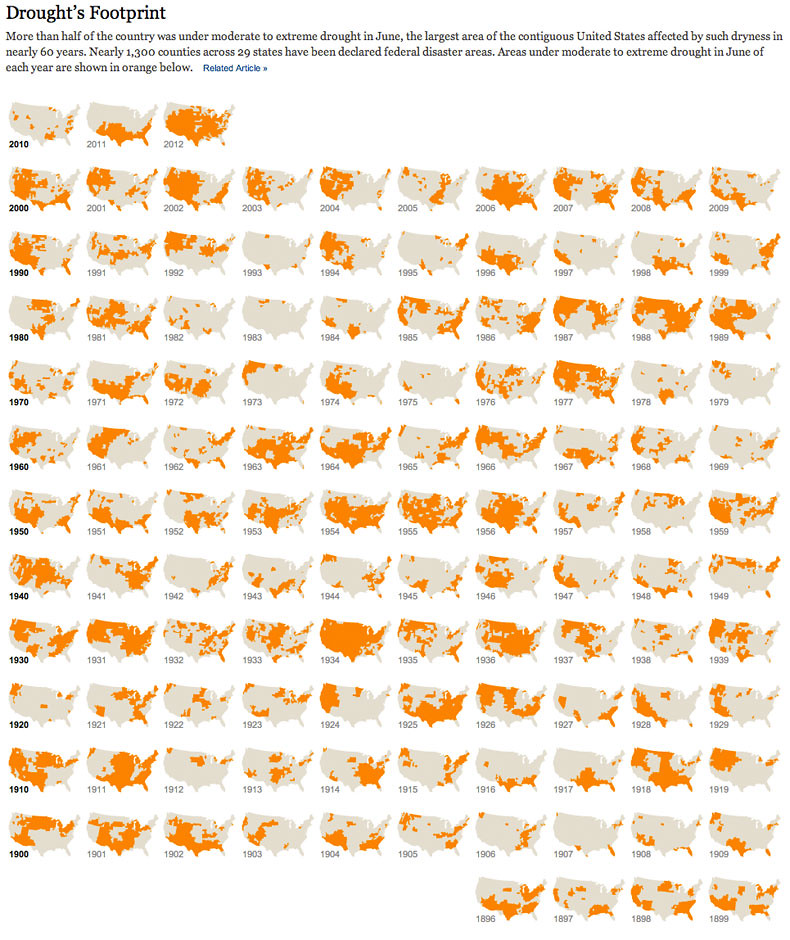
…before deciding on the 10-by grid, which is cool because you see an entire decade in every row. (This had not occurred to me until I saw it on the page.) They reordered them to go back in time, with 2012 on top: