Just over a week ago we published a graphic – more of an interactive short blog post without a blog, really – that accompanied Tyler Kepner’s piece about strikeouts for the Times’ 2013 baseball preview. The subject of both pieces was the steep increase in strikeouts across the board in the past decade: last year, ten Major League clubs set franchise records for strikeouts.
The fact Tyler came to us with was one he’d found on his own: 18 teams struck out at least 1,200 times last season; through 2005, there had never been a season in which more than two teams topped that total. Below, the first sketch, based on that stat – the number of teams with 1,200 strikeouts or more in a season going back to 1968:

That’s a compelling chart, but it’s also a little misleading because the league has expanded a few times and not all seasons are the same length.
Instead, Joe Ward and I thought about making small multiples of the teams and arranging them in a sort of histogram, sort of like my colleague Bill Marsh did with exit polls in 2008 and 2012.
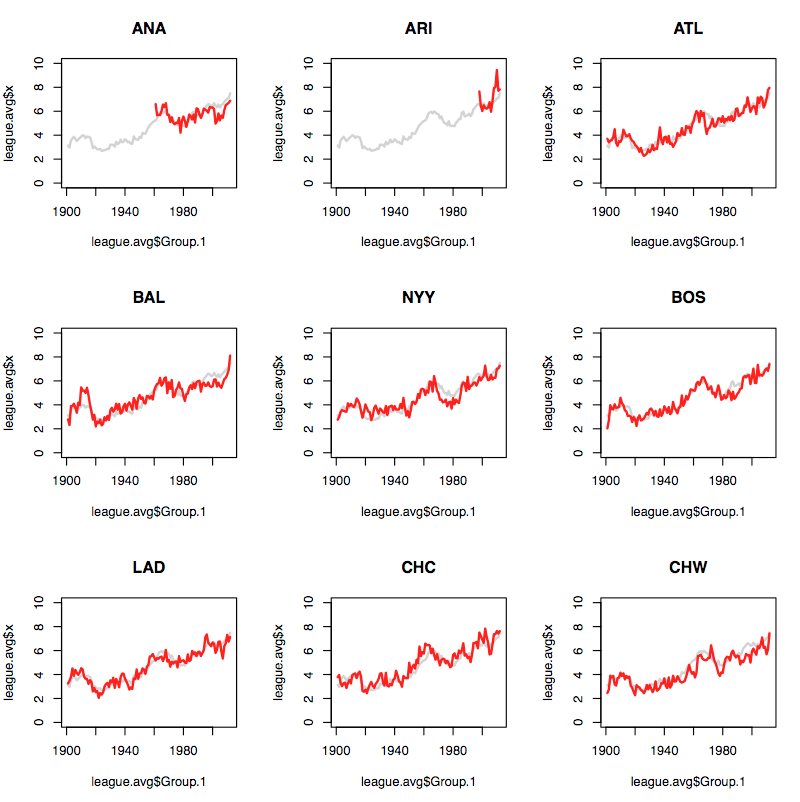
Here are the first nine teams in alphabetical order, with the league average in grey:
We didn’t really care for these, and I complained about it to my colleague and cubicle-partner Alicia Desantis, who suggested I make it look like the climate change “hockey stick charts.” (FYI, The image below, one of the better ones from Wikipedia, is meant to convey the form, not wade into the “Hockey Stick controversy“ if you believe there is one.)

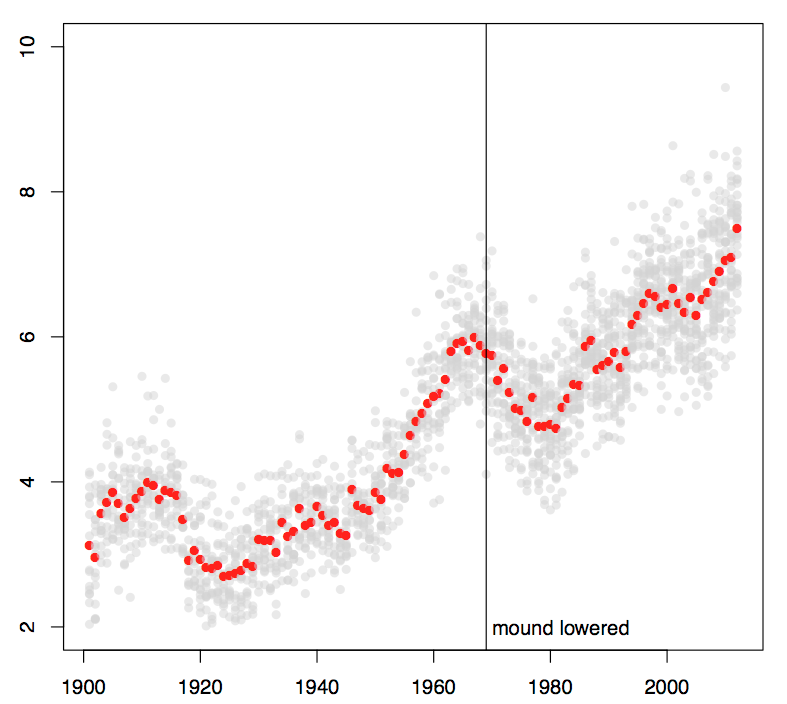
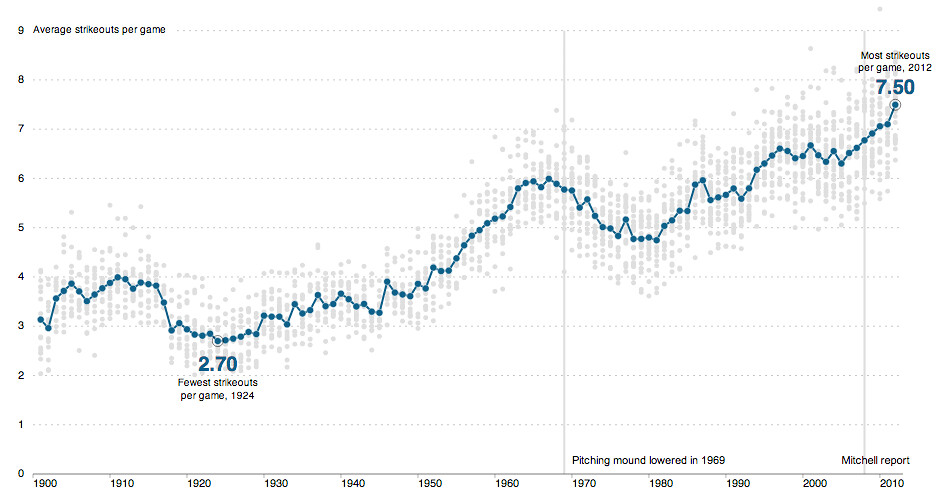
Here’s what the first R sketch of that idea looked like – every team’s average strikeouts per game per year. (Red is the league average.)
At this point, we had a chart we liked and the process went forward like many of our other projects do. However, there was a key difference with this one that’s worth mentioning - all the rest of the sketches, edits and and design improvements happened in a web browser. (More on this later.)
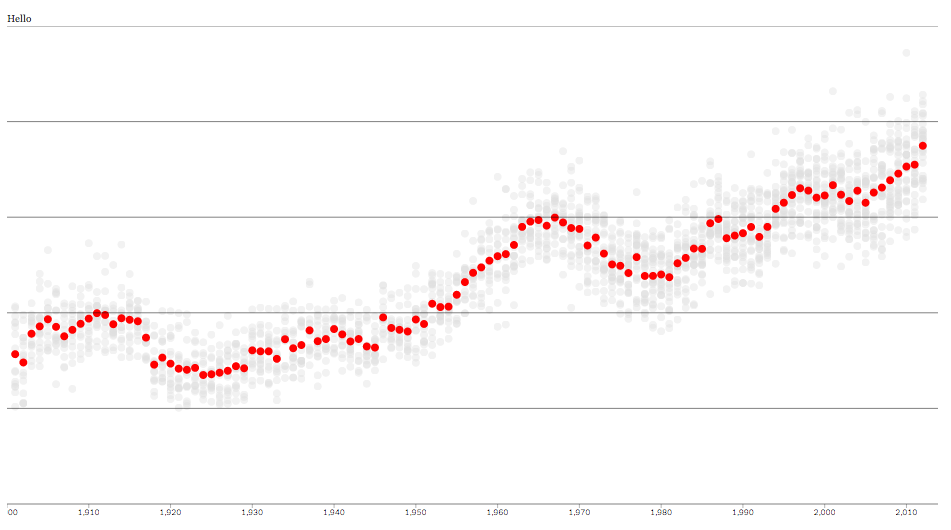
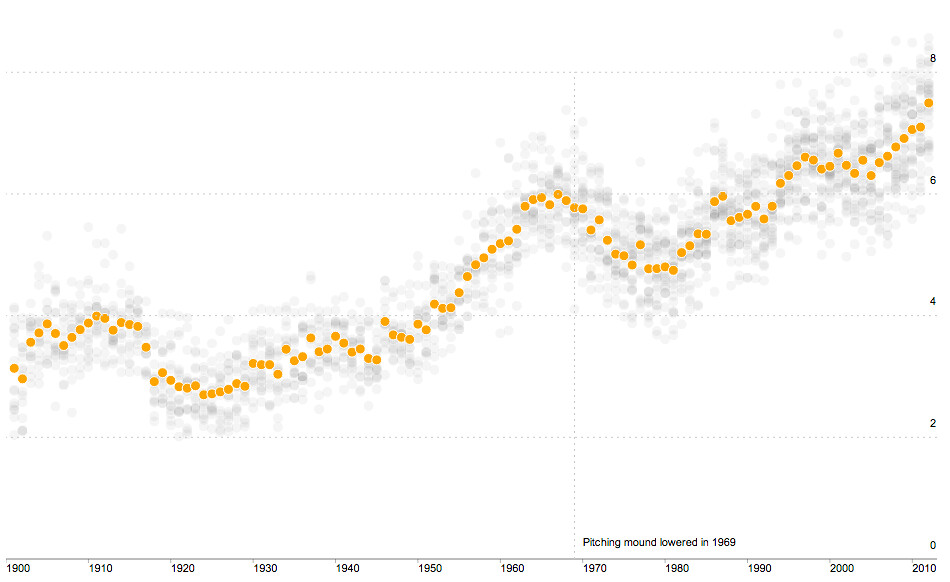
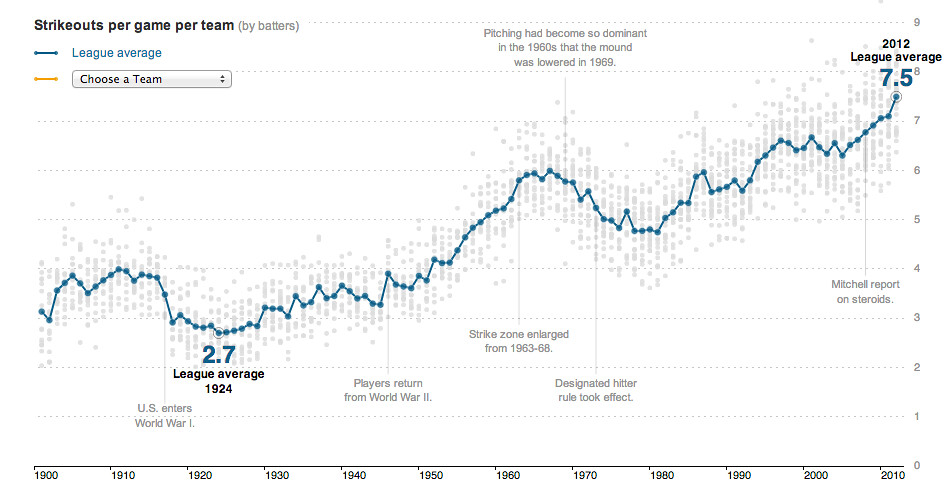
Here are a few successions of this chart, made using D3:
Checkin #2
Checkin #6
Checkin #22
As it appeared when published (Checkin #142)
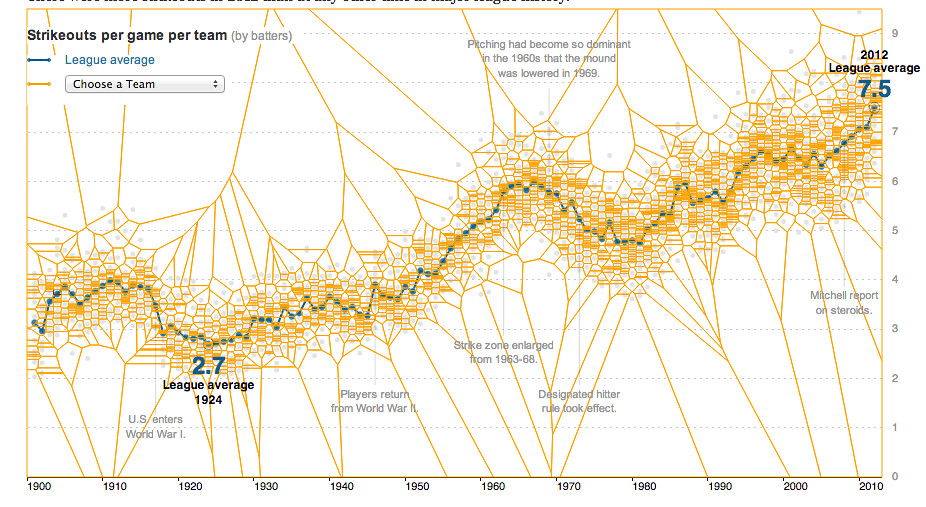
UPDATE, now with more Voronoi, as per Mike’s request:
A few final technical notes worth mentioning:
Getting this data from baseball-reference.com requires a bit of scraping, and this project sold me for life on R’s XML package, which makes scraping fast and shamefully easy.
In the final project, there are three interactive charts and a table on the page, and they are all generated in D3 with just one data file. The whole chart form – line selection, tooltip, calculating averages – is easily abstracted out, and for the first time I felt some of the same sketching power in a browser that I’d seen only with R: the concept that if you can make one chart, you can make a hundred with the same effort. But with D3, the sketches are already in a browser and wired for interaction! From a development point of view, it felt tremendously powerful. (For many of you this might be obvious, but old habits die hard.)
Also, thanks to the open-source SVG Crowbar bookmarklet developed by Shan Carter, this project represented a recent change in development process, for me, at least. Instead of developing both print and online charts separately, we were able to generate all the charts for print in a web browser at precisely the sizes we wanted, then save them down to Illustrator. Aside from being a useful shift in thinking, it saved a ton of time. (This isn’t the first time the department has done something like this – just the first time I did.)
For example, we included the small multiples in print, but we made them in D3 first:

Here’s the two-page spread in print. Again, all these charts were produced in a browser, saved to SVG and edited lightly in Illustrator.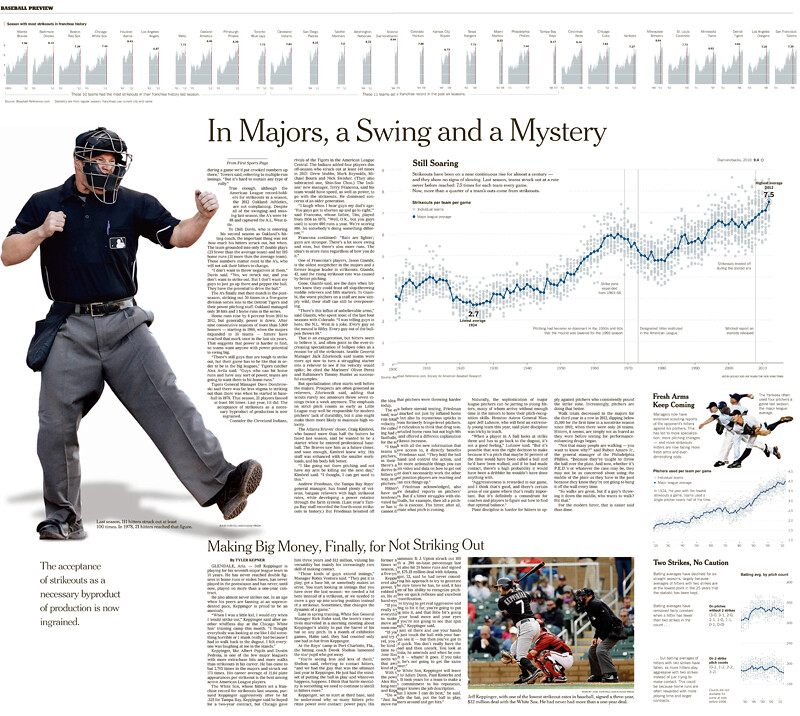
Finally, for the record, most of the best parts of this graphic were made by Shan while I was on vacation (with standard last-minute triage from Amanda Cox and Mike Bostock), and all the meaningful annotation was from Joe Ward, who, did you know, played D1 baseball and was a scout for the Cleveland Indians before coming to the Times?