One of the best things about working at a newspaper is that you can come into work and do something different every day. Yesterday I had planned on spending the day doing some longer-term work in preparation for the Olympics and generally phoning it in Friday-style when a handful of us got assigned a daily – a graphic that looked back on Mariano Rivera’s career in light of his A.C.L. injury on Thursday. I was totally going to do an insane 3D-video that analyzed his cutter, but apparently someone did that already, so we went with charts instead. I looked at saves over time of top pitchers while my colleague Tom Giratikanon, who just started this week, compared Rivera across different categories.
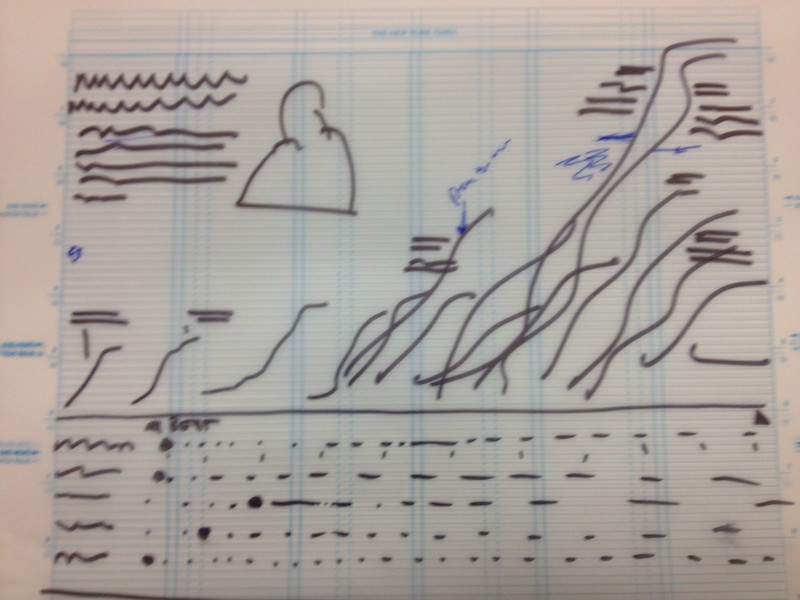
We had a broad idea for what we were going for, which Matt Ericson sketched out by hand:
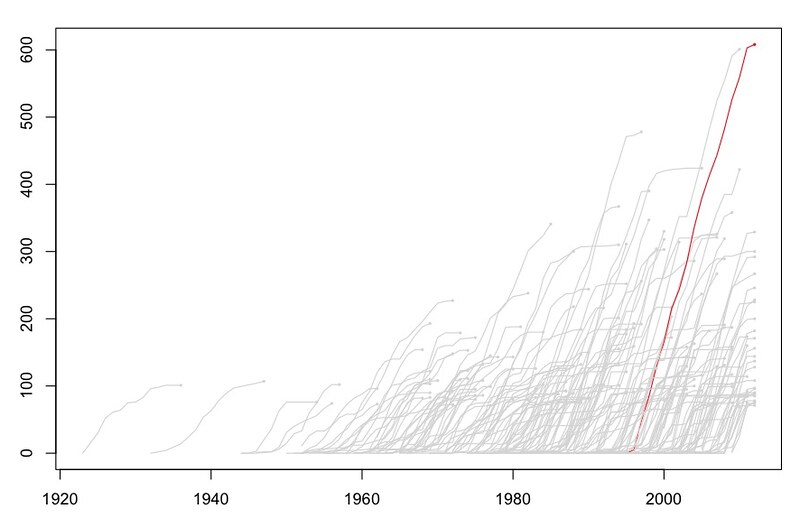
I scraped the data for the players with the most saves from baseball-reference.com (using an old template Shan Carter made using hpricot, which I learned is now “over”), then sketched the top 250 or so in R. This only takes a couple seconds to read about, but it was in fact at least two hours of screws ups and swearing before I saw this chart:
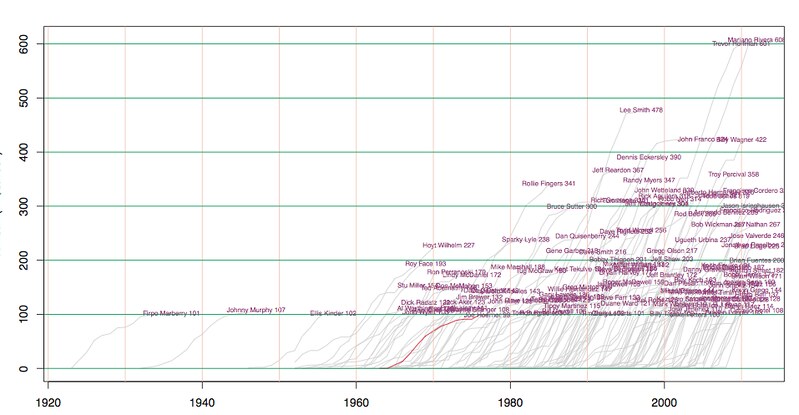
Which eventually turned to this (we export odd colors to pick them up easily in Adobe Illustrator):
And the final print version:

Online, we took basically the same approach, except we wanted to make them interactive, so Shan Carter pitched in some D3 expertise and Tom made his in Raphael, and six painless hours later, after all the programming, browser checking, conditional loading (which might not be a term) and Matt Ericson VPNing in from New Jersey to fix everything, we had a nice interactive, mostly mobile-friendly graphic:
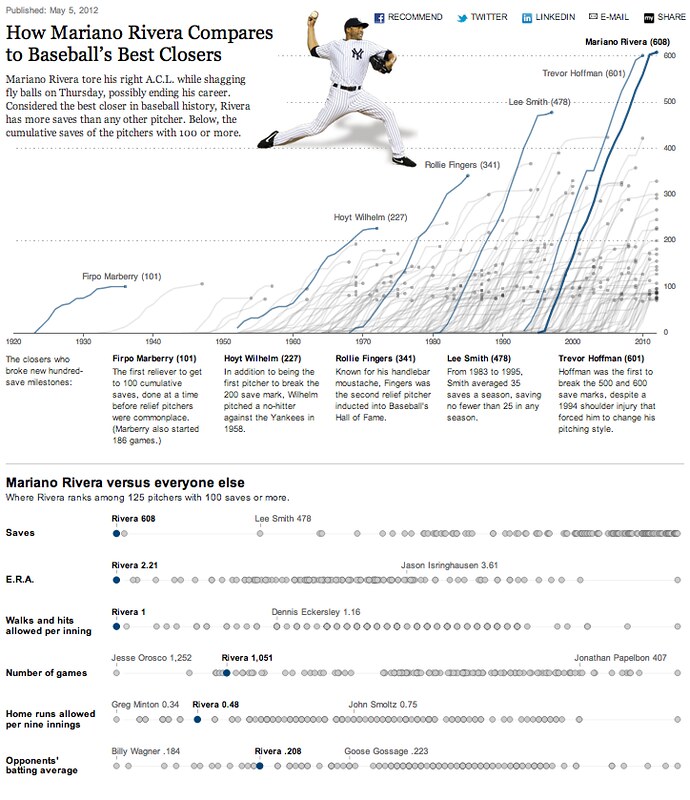
Our approach wasn’t revolutionary or anything – in fact, Amanda and I used an identical charting form to chart home runs a couple years ago – but the package worked well, and if anything, Rivera stands out more in the saves chart than Barry Bonds does in the homers chart. And it was a promising start to the possibility of turning around this kind of work on deadline.