Approaching good enough in Excel
The big 4 – sorting, filtering, aggregating and merging – are enough to help you answer 99 percent of data questions. And almost all the time, Excel will be all you need. Today, we use Excel in two real news situations, including formatting is as it actually comes in the real world.
Housekeeping
- General thoughts on project pitches: think small + manageable
- Project requirements and pitches, which are due Monday.
- Critique time
Basic skills when your data is bigger
A digression: sometimes data is published to the web, but, without context, it’s hard to know whether it’s interesting or not. Here’s an example about NYC school attendance from WNYC.
It’s easy to pull down this data every day, but, pretty quickly, it’s going to get big enough that you will regret any cheating / manual labor you might have done in our earlier exercises last week.
Excel work doesn’t have to look like it

Your job is to identify as many people as you can in the picture above.
The easiest people to identify in the picture should be the runners. From the online results, here’s a spreadsheet.
Here’s a wrinkle: not everyone in the photo started at the same time. Here’s what the race organizers have to say about that: “Red bibs (numbers 101 - 8,999) are assigned to Wave 1 (10:00 a.m.). White bibs (numbers 9,000 to 17,999) are assigned to Wave 2 (10:20 a.m.). Blue bibs (numbers 18,000 +) are assigned to Wave 3 (10:40 a.m.).”
Subtract 40 minutes from the finish gun off of everyone with a bib number less than 9000, and 20 minutes from everyone with a bib number from 9000 to 17999.
Make a list of runners to call. Put their first and last names into separate columns with some combination of “Data -> Text to columns” and find and replace.
Here’s the NYT take.
Data in the real world
Unfortunately, data doesn’t always come formatted the way we like. Let’s take a recent example from last year with some data about successful gun traces out of Chicago. (A gun trace is where they find out where a gun found in a crime was purchased.) After some phone calls, you get your hands on some source data. Go ahead and download it and open it in a spreadsheet.
Take a look at the data. What does one row look like? What does our dream data set look like? Do the things we always do: know dimensions, make a copy, give the columns names.
Let’s think of questions we might ask of our dream data set instead of this data set. What are some headlines we wish we could be able to write? Add a couple of your own in this Google Doc. This is a ‘hat-on’ exercise, so don’t be shy.
Name the sheet
traces. How sad does this data make us?Make columns called
county_cleanandstate_cleanthat has just have counties and states only.How useful would a pivot table of countyclean be? Do a filter in `cleancounty` for “Washington”.
It’s pretty clear that we need some data that has unique values for each county. Google “US county fips codes” and see what the Census has to offer (though any of them are probably fine, we should stick to government data). Save the file locally and enter it as a second sheet in your main Excel file. Call the sheet
FIPS. BLAMO and clean it up, doing the normal things we do.Be happy if your sheet looks like this:

Make a new column for the 5-digit county FIPS code for each county. Call it
5_digit_fips. There are lots of ways to do this.How are we going to join our data?
Remove the word “county” from
county_namein a new field calledcounty2.In both sheets, make a new column called
joinfieldthat pastes the county name and state together, separated by a hyphen. You might need to do this in steps.We’re ready to make a crude attempt a vlookup. Try to get a column called “county_fips” in your traces sheet.
Which ones didn’t match? Why?
Make a new field called is_error that gives you a 1 if there is an error and a zero if there is not.
Sort your traces data by is_error and then count, both decreasing. This will let you prioritize your targets and quantitatively answer how good our merge was. How many do we need to fix?
Seek and destroy! There’s no wrong way to do this, but some ways are righter than others. Keep going until you have matched 98 percent of guns and are not missing any counties with more than 30 guns traced. (Protip: a pivot table of
is_errorand sum ofcountwill be helpful.)With the FIPS codes, what can we do that we couldn’t before?
Can we answer this question the way we did this join? “What percent of counties had at least one gun traced to Chicago?”
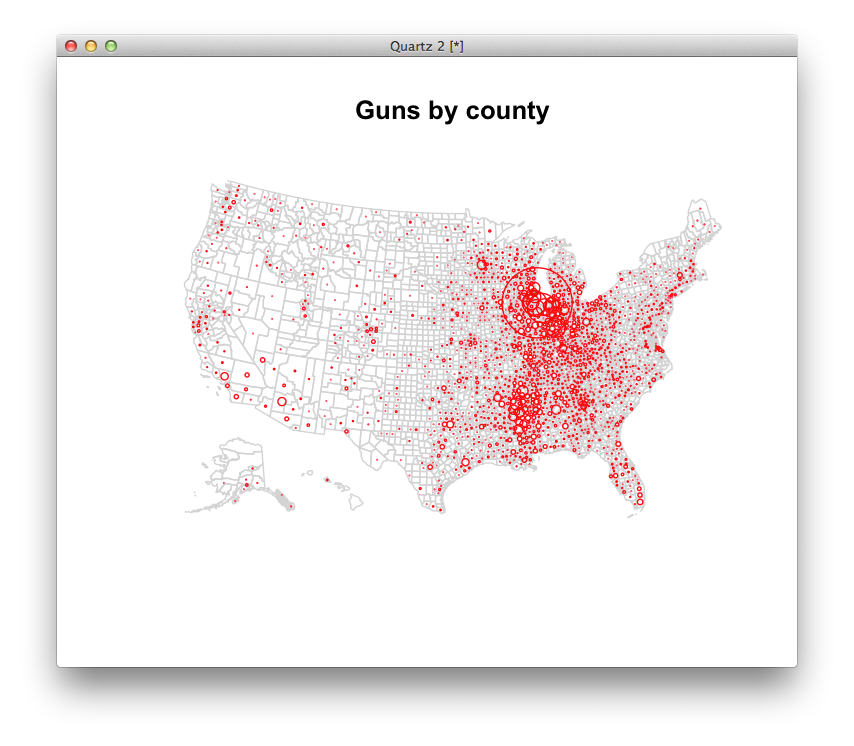
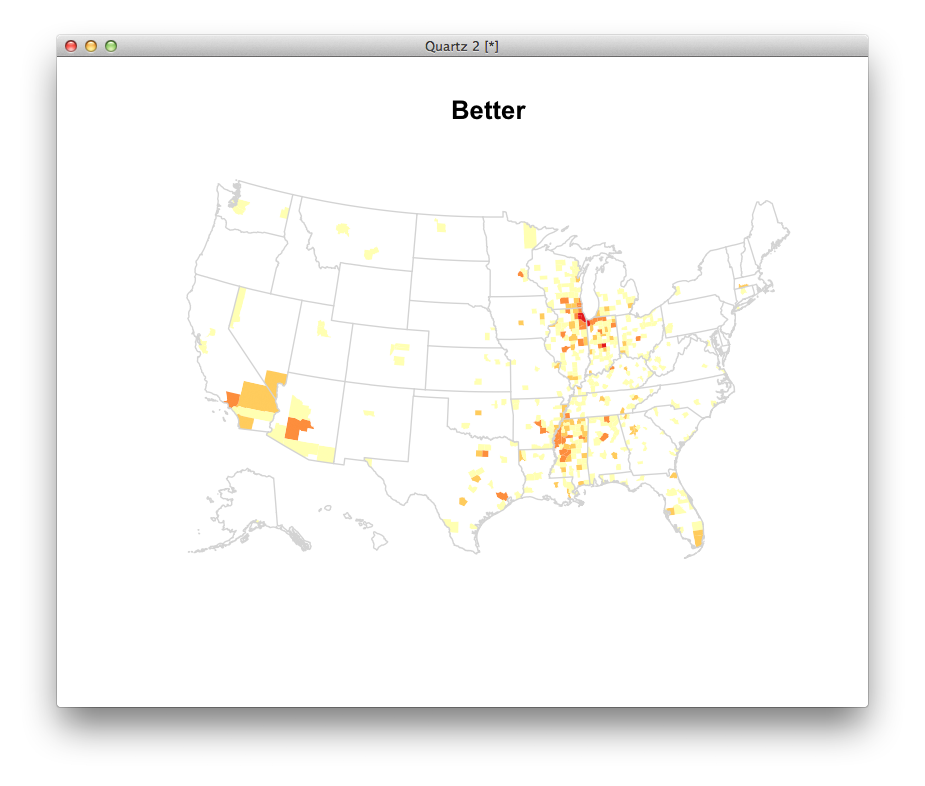
One stats program called R would let us map these without too much trouble. What questions might these maps lead you to ask? Where might you go to get answers?
If there’s time
• More aggregating practice from last week. • Projects.