Doing the dirty work
The big 4 – sorting, filtering, aggregating and merging – are enough to help you answer 99 percent of data questions. But most of the time, your data doesn’t come ready to party. Today we’ll clean messy data as it comes in the real world and then embark on Stage 2 of our class data gathering project.
Housekeeping
- General thoughts on project pitches: think small + manageable
- Project requirements and a look forward
- Sarah, Cayleigh, & Kristin are leading a discussion on drug labels
- When things are broken.
Part 1: Data in the real world
Unfortunately, data doesn’t always come formatted the way we like. Let’s take a recent example from last year with some data about successful gun traces out of Chicago. (A gun trace is where they find out where a gun found in a crime was purchased.) After some phone calls, you get your hands on some source data. Go ahead and download it and open it in a spreadsheet.
Take a look at the data. What does one row look like? What does our dream data set look like? Do the things we always do: know dimensions, make a copy, give the columns names.
Let’s think of questions we might ask of our dream data set instead of this data set. What are some headlines we wish we could be able to write? Add a couple of your own in this Google Doc. This is a ‘hat-on’ exercise, so don’t be shy.
Name the sheet
traces. How sad does this data make us?Make columns called
county_cleanandstate_cleanthat has just have counties and states only.How useful would a pivot table of county_clean be? Do a filter in
clean_countyfor “Washington”.It’s pretty clear that we need some data that has unique values for each county. Google “US county fips codes” and see what the Census has to offer (though any of them are probably fine, we should stick to government data). Save the file locally and enter it as a second sheet in your main Excel file. Call the sheet
FIPS. BLAMO and clean it up, doing the normal things we do.Be happy if your sheet looks like this:

Make a new column for the 5-digit county FIPS code for each county. Call it
5_digit_fips. There are lots of ways to do this.How are we going to join our data?
Remove the word “county” from
county_namein a new field calledcounty2.In both sheets, make a new column called
joinfieldthat pastes the county name and state together, separated by a hyphen. You might need to do this in steps.We’re ready to make a crude attempt a vlookup. Try to get a column called “county_fips” in your traces sheet.
Which ones didn’t match? Why?
Make a new field called is_error that gives you a 1 if there is an error and a zero if there is not.
Sort your traces data by is_error and then count, both decreasing. This will let you prioritize your targets and quantitatively answer how good our merge was. How many do we need to fix?
Seek and destroy! There’s no wrong way to do this, but some ways are righter than others. Keep going until you have matched 98 percent of guns and are not missing any counties with more than 30 guns traced. (Protip: a pivot table of
is_errorand sum ofcountwill be helpful.)With the FIPS codes, what can we do that we couldn’t before?
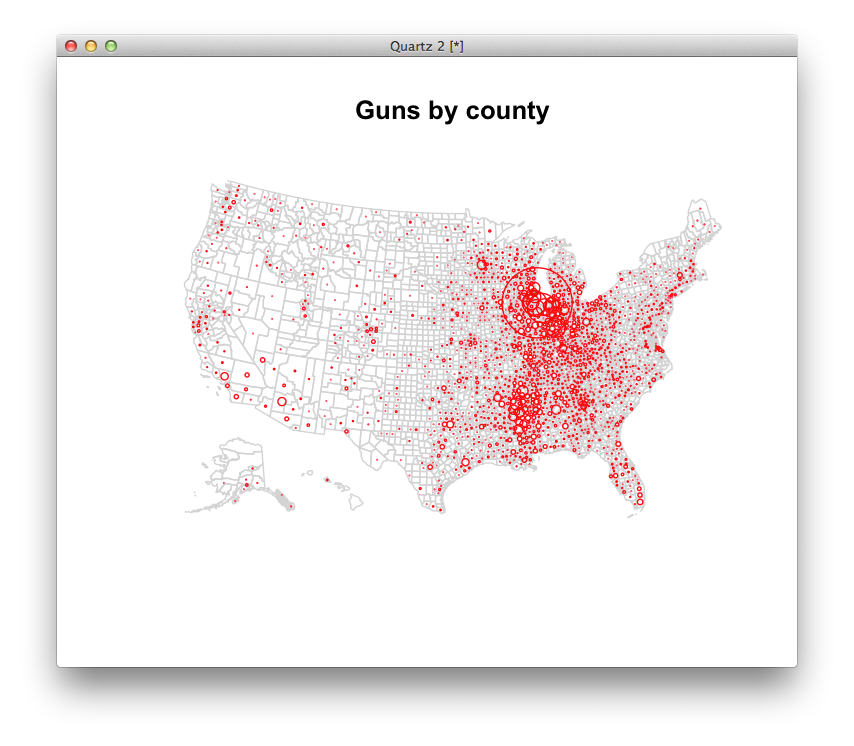
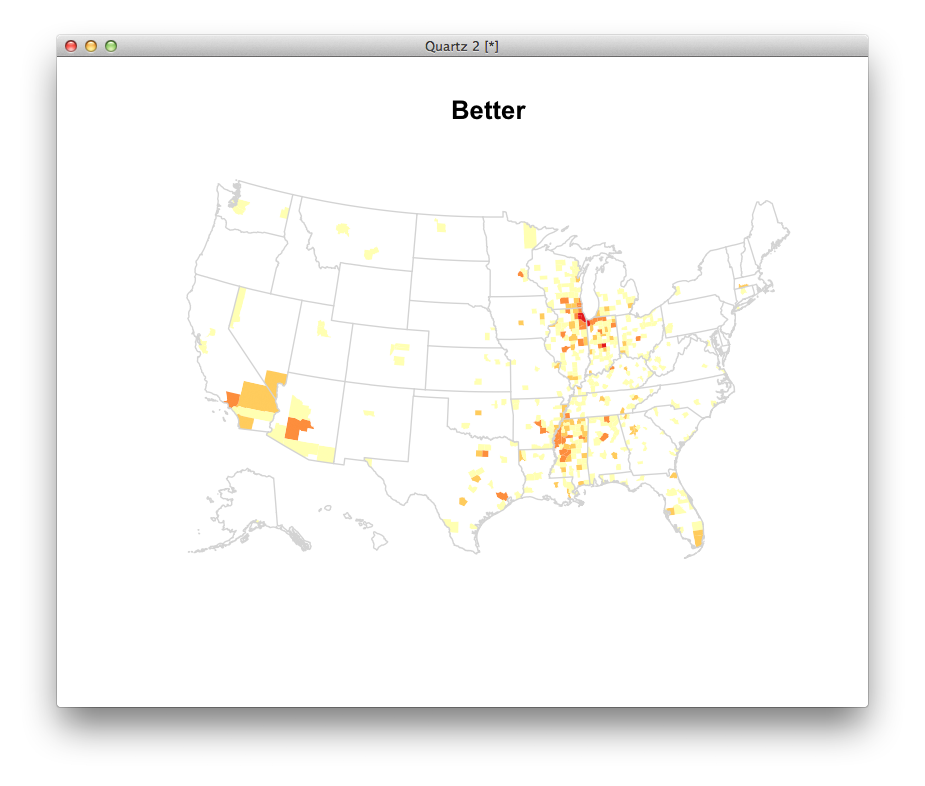
Can we answer this question the way we did this join? “What percent of counties had at least one gun traced to Chicago?”
One stats program called R would let us map these without too much trouble. What questions might these maps lead you to ask? Where might you go to get answers?
Where we left off.
The typical graduation rates reported for colleges are broken, in part because transfer students are counted in the same way as drop-outs. How could you fix this?
Some schools voluntarily give their progress data to a group called College Portraits. Here is a sample report. But even friendly people associated with that project don’t know they have the data in a database. I suspect they do, but I’m not sure. I have scraped the data, and done some work to standardize it for you here. For the extra curious, here is some horrible code.
Note that there are some small difference between the 2013 reports and the 2012 ones.
Take 20 minutes to explore the data, generating a list of questions, facts, and weirdness you uncover here. Your goal is questions that are both answerable and could turn into interesting ledes.
Let’s come up with a gameplan for collecting the data for the biggest schools. What do we need?
Let’s practice aggregating to see how far we have to go. Here’s something for that.
In the doc with your questions, let’s draft a request for data from a school.
Don’t try to be too complicated at the beginning. Start with very easy questions - think averages, top 10 lists, outliers. After you have those answers, then you can add fanciness.
We are looking for things that we don’t expect. Washington Monthly’s rankings are based on the same idea.
Find two schools that with similar characteristics, but very different graduation rates.
Expanding our college graduation sample. If we were to try, how far would we have to go?
Here’s a list of schools for that. How many schools would we have to contact if we wanted to cover, say, half of the nation’s undergraduates? 75%? How else could we restrict our sample?
Write our letter.
Let’s do it together here.
Homework
You have two choices. You may fill out 40 rows with contact information in this document. Or you may embark on your own data collection project of a similar scale. If you choose the later, please push it to your github page.